

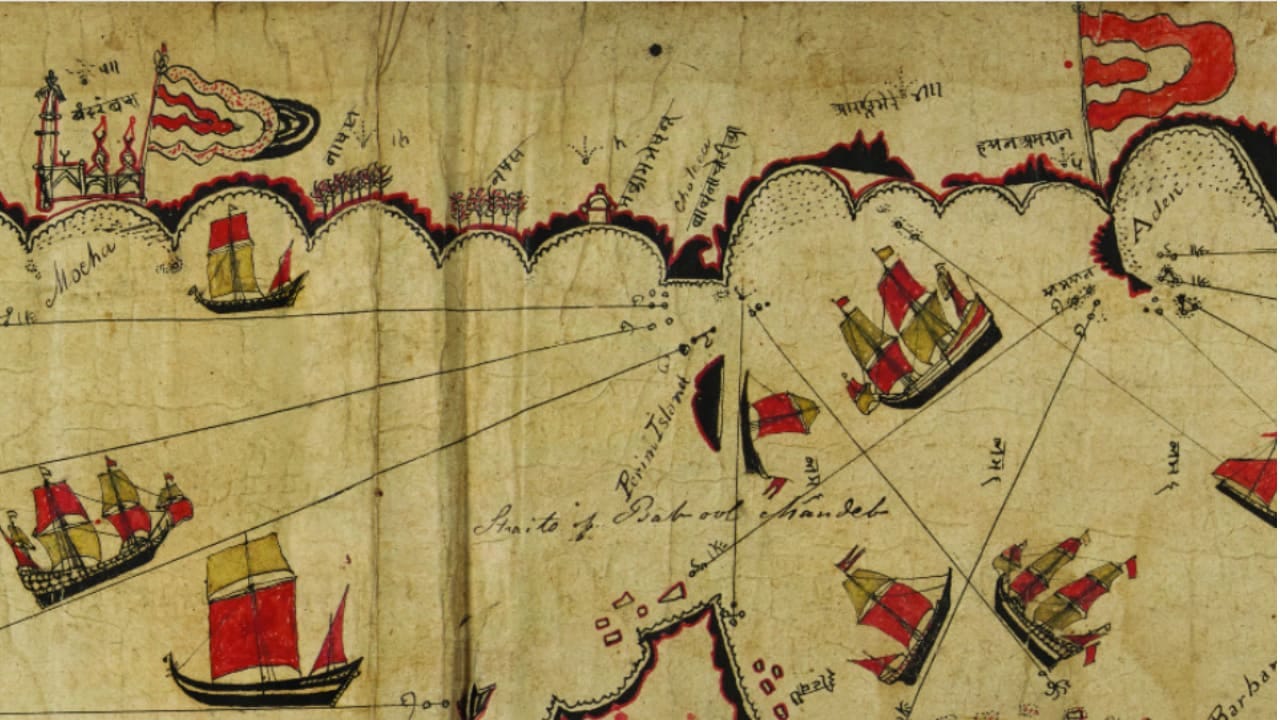
For 189 years a paper scroll has sat in the collection of the Royal Geographical Society in London, catalogued, examined periodically, and fundamentally misread. Drawn by a sailor from Kachchh in what is now Gujarat, it maps the southern Red Sea and the Gulf of Aden, and to a modern eye trained on precise scale and projection it looks distorted and approximate. Researchers have now shown that it is nothing of the sort. It is a working navigational instrument, and a sophisticated one.
The study, by John P. Cooper of the University of Exeter’s Institute of Arab and Islamic Studies with co-author K.D. Rajani, was published in the Journal of the Royal Asiatic Society and runs to 66 pages of analysis.
Given to me by a pilot
The chart reached London through Alexander Burnes, a lieutenant in East India Company service and assistant to the British Resident in Kachchh, who obtained it from a sea captain and donated it to the Royal Geographical Society in 1835. Burnes gave it an English title describing it as a native Indian chart of the coast of Arabia and the Red Sea, drawn by an inhabitant of Cutch and used by pilots then working that navigation. His note on its acquisition is brief, that it was given to him by a pilot. The unnamed sailor who made it left no title of his own.
The manuscript itself, catalogued as mr Asia S.4, carries the chart on one side, while the reverse holds ten separate texts pasted on as backing to reinforce the paper. It is illustrated with ships and religious buildings, and it records more than 180 islands together with reefs, landmarks, and flags. Sixty-six place names are written in Devanagari, the script used for Sanskrit, Hindi, and other Indian languages.
Dating rests partly on how those letters are formed. The script retains the shirorekha, the horizontal line drawn above Devanagari characters, a feature Gujarati script had largely abandoned by the nineteenth century. Its survival here, in a document that is plainly a working tool rather than an official or elite production, points toward an eighteenth or very early nineteenth century origin, an inference supported by other archaic letterforms.
Overlooked five times
Scholars examined the chart in 1947, 1987, 2002, 2012, and 2022. Each time, the researchers note, its navigational function was largely passed over. Roughly half the Devanagari place names were left unidentified or unlocated, and more still lacked precise coordinates.
Cooper and Rajani set out to read it as what it was, a tool for finding one’s way at sea. They produced improved transcriptions of the Devanagari, identified and located all 66 toponyms, and interpreted the astronomical data written on the chart. With that information they were able to build a projection, plotting the chart’s contents spatially against Polaris altitudes and stellar bearings, which allowed the original information to be compared directly with modern geography for the first time.
The chart’s 29 rhumb lines turned out to serve three distinct functions, establishing the general trend of a coastline, indicating a direction of travel across open water, and, in at least two cases, marking safe passage into and out of harbor.
Latitude by starlight
The system underlying all of this predates instrument navigation in the region. Sailors determined latitude by observing the altitude of Polaris and other stars, and the chart records that stellar information alongside its place names and coastal detail. Together the two allowed a navigator to know both where he was and which way to steer, in some of the most demanding waters in the world.
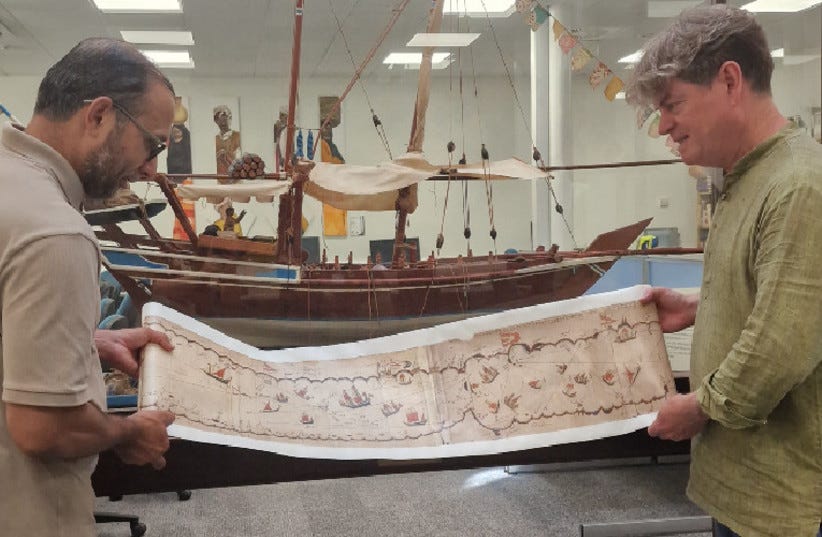
Cooper is direct about the gap between how the chart looks and how it worked. Modern maps project space mathematically and to scale, he notes, which makes the world visually familiar in a very particular way. This chart does not do that, and by that standard appears inaccurate, yet it allowed seafarers with the right experience and knowledge of stellar navigation to work waters that were genuinely dangerous. All of it fitted into a portable scroll just 25 centimeters wide.
Other elements of the chart carried meaning too. Its stellar data gave latitude and course. Its place names and topography let a sailor fix his position. The religious buildings drawn on it suggest the navigator was Muslim. The flags, in Cooper’s reading, mark nodes of political and fiscal activity, the places where authority and money were concentrated along the route.
Not a map for strangers
An important qualification runs through the work. The chart was never meant for general use. Its information, however rich, would not have been enough to let anyone unfamiliar with regional seafaring traditions navigate safely.
For someone already initiated, it worked as a mnemonic, a handy reference that prompted and organized knowledge the sailor already carried. The scroll format supported that use directly, since it could be unrolled partially to show only the stretch of coast in question while the rest stayed wound away, easy to store and handle on a working ship.
That is the deeper point of the research. What survives on paper is a fragment of something largely intangible, a body of navigational knowledge held in the heads of sailors from Kachchh and Gujarat, sustaining trade between India, Arabia, and the Horn of Africa across the age of sail.
Katherine Parker, the Royal Geographical Society’s cartographic collections manager, framed the result as an argument for going back to material already in the archive. Re-examining collections is a continuing process, she said, one that lets researchers bring new methods and perspectives to objects and recover the meaning they held for the people who made them.
Sources: University of Exeter; Royal Geographical Society. Cooper, J.P., and Rajani, K.D. (2026). “Kachchhi-Gujarati Navigation in the Red Sea and Gulf of Aden in the Eighteenth and Nineteenth Centuries, an Intangible Knowledge System, Charted.” Journal of the Royal Asiatic Society, 1 to 66. doi.org/10.1017/S1356186325101284